
It’s essential to monitor the resources and applications of your Kubernetes Cluster. Do you still have enough resources for another application? Do you have something crashing constantly? Do you have any pods using more resources than you planned? Why is that? These and other questions can be responded to with a good logging and monitoring system.
In this article, we will talk about 2 of the most famous tools in the Kubernetes world for this job: Prometheus and Grafana. You will understand what these tools do, how to install and configure them in your home lab, and never be blinded again about your cluster.
Let’s resolve the storage first.
We talked about different ways to handle storage in Kubernetes Cluster, including a method used by several clusters in production these days, using NFS to serve all our Kubernetes apps storage.
But I want to test something different here. The NFS works fine, but I want to use the nodes space directly and better visualize what’s happening rather than just looking at the NFS folders. Besides that, as I’m using proxmox to virtualize all my nodes, I’m already taking snapshots of them, and if the data is saved on the nodes, it will also be in the backup snapshots.
There are many options to do that in Kubernetes, and after deep research, I decided to give it a try to Longhhorn.
Longhorn is a cloud-native distributed block storage for Kubernetes; it is open-source and free to use. It also gives us something closer to the cloud providers’ solution for storage (block storage) and can smooth our migration or deployment in a cloud production environment.
Feel free to skip this section and use your already installed storage solution if you want; the installation and configuration of our monitoring system will be the same.
How to install Longhorn on K8s?
You can install Longhorn in different ways. The most famous is, like all apps in K8s, using Helm. But I always prefer to use the yaml files directly if this method is available. And yes, for the Longhorn, we can use this option.
kubectl apply -f https://raw.githubusercontent.com/longhorn/longhorn/v1.4.2/deploy/longhorn.yaml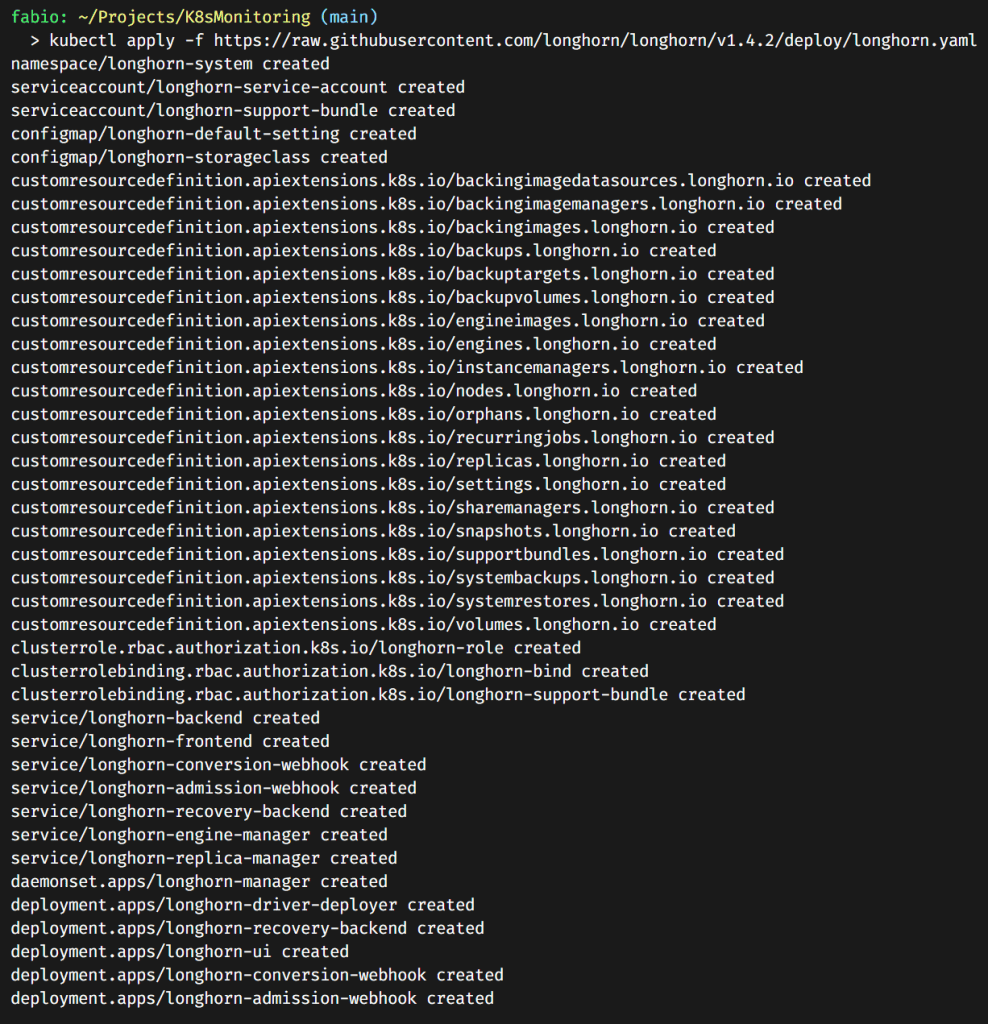
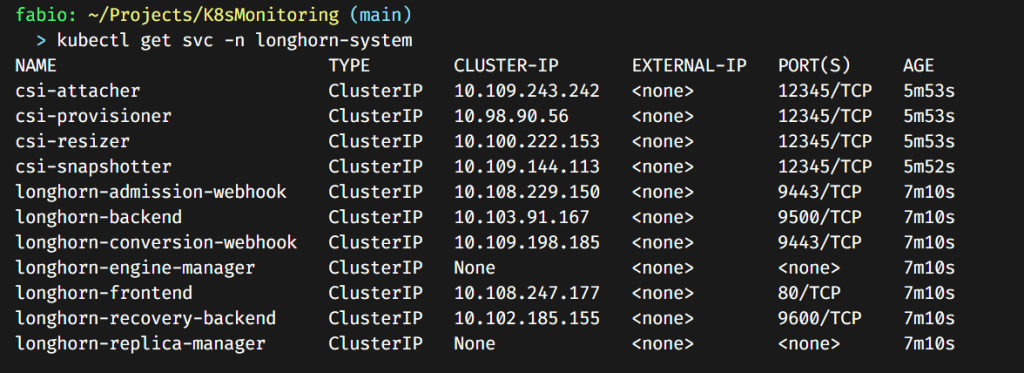
It installs a bunch of stuff. If you pay attention, you will see we have a longhorn-frontend service. This is the service pointing to the Longhorn dashboard.
What if we configure this access via traefik ingress with certificates? You must have the Certmanager working in your current cluster to make it happen. If you don’t have it, skip this section or check the dedicated article I wrote about it to configure your cluster: Managing SSL in your K8s Homelab: Professional Grade.
A quick check if our service is running:
Creating the certificate for the dashboard
I will again use the ff1.dev domain as I did before. This time I will use Longhorn.ff1.dev.
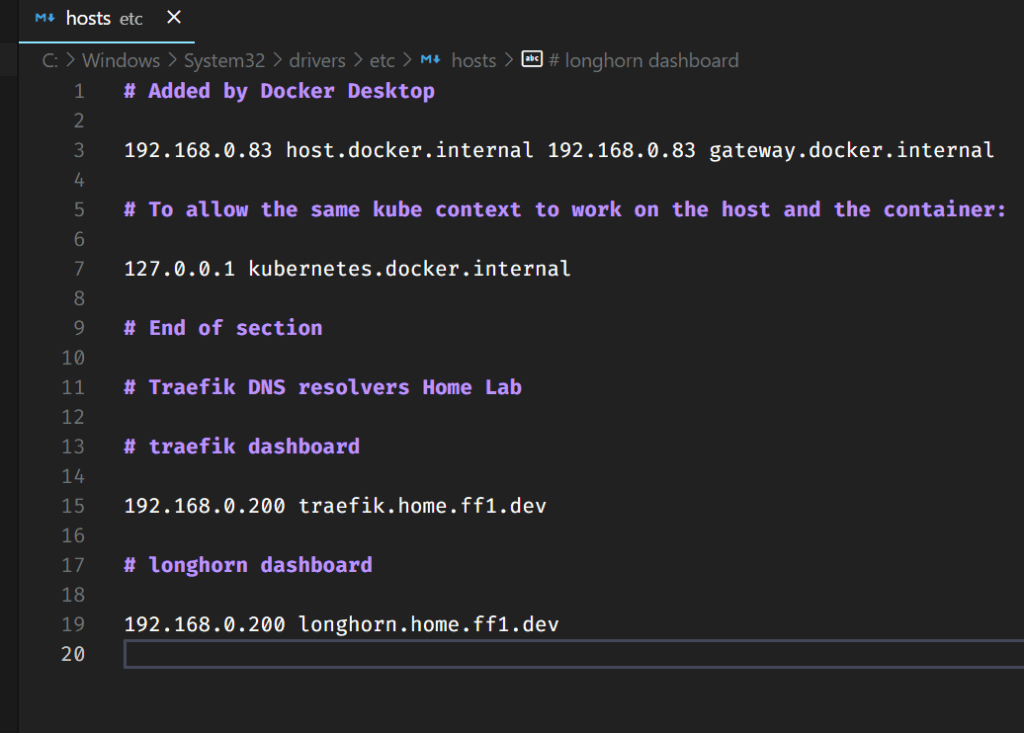
Adding the name to my hosts file (I still do not have a dedicated DNS server for these entries) above and creating the certificate file (below)
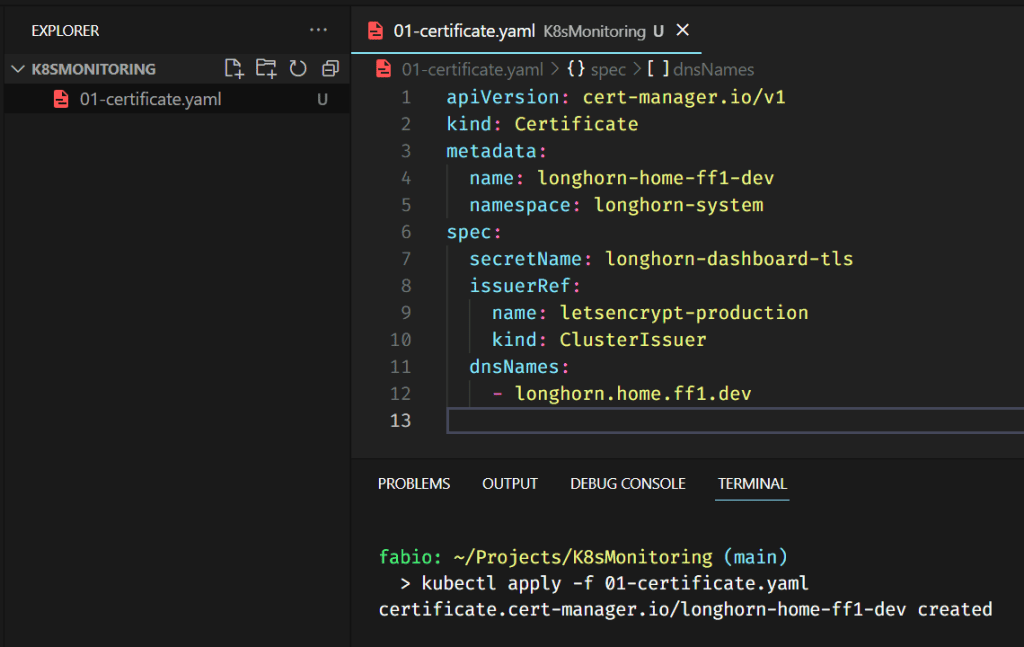
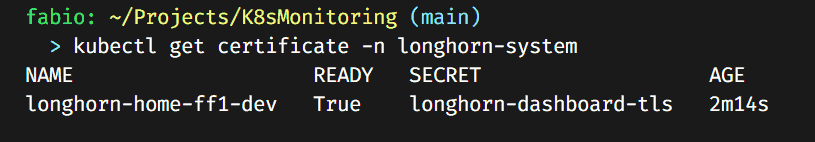
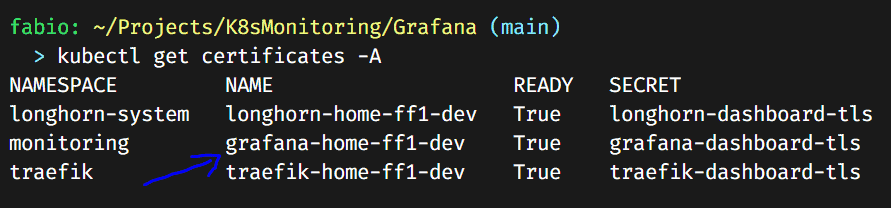
Check if the certificate is up and running.
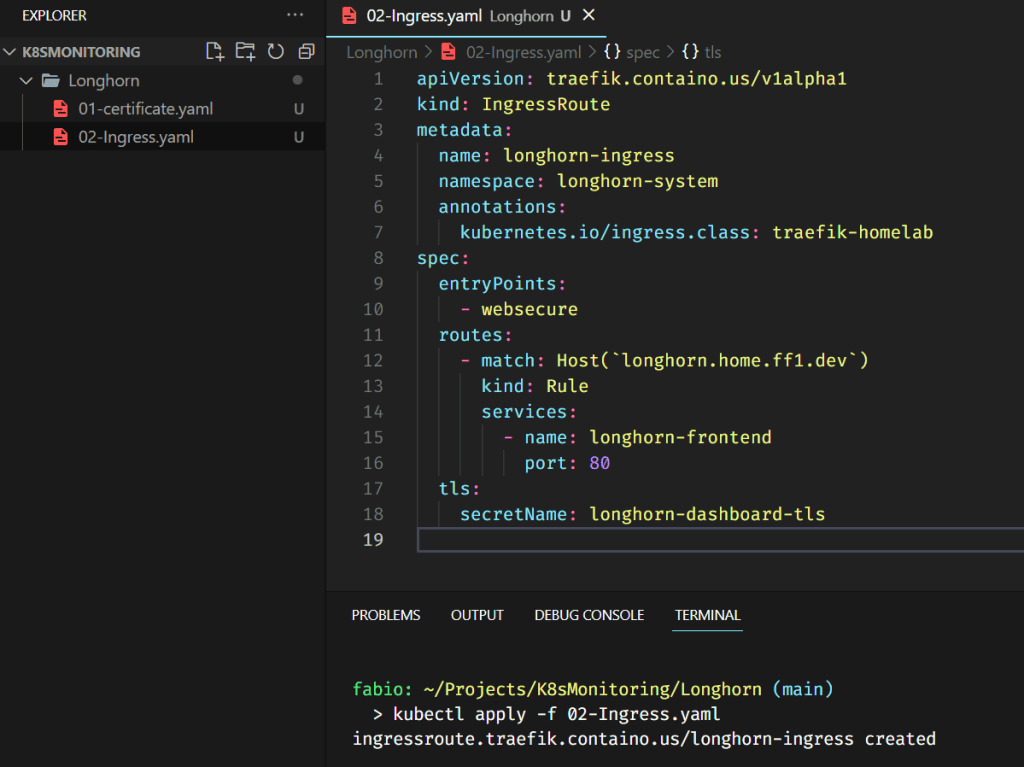
Configuring the ingress route
Now that we have our certificate, we need to configure the traefik ingress route to point the name longhorn.home.ff1.dev to the newly created longhorn-frontend service (using the secret key with our certificate). The file below does precisely that.
Note: All these files are accessible on my GitHub (https://github.com/fabiofernandesx/K8sMonitoring)
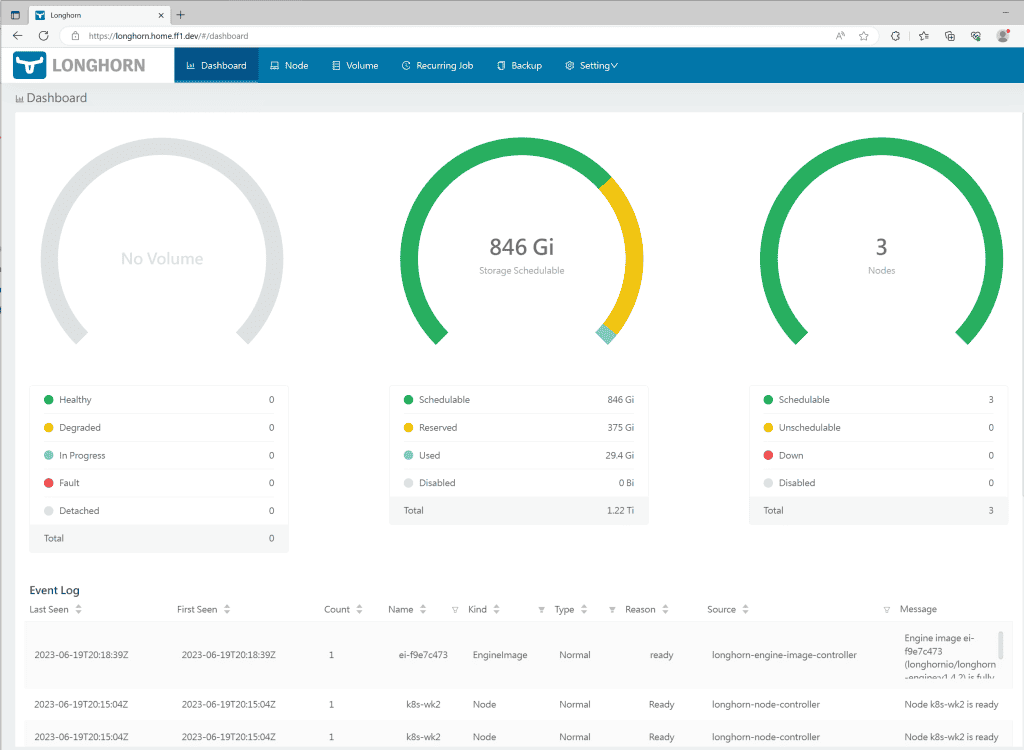
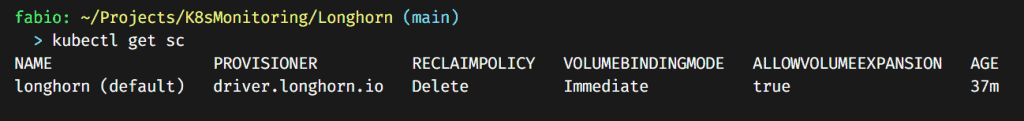
Let’s quickly check if Longhorn is configured as our default storage class.
Test the default storage class.
To test our default storage class quickly, let’s deploy an NGINX site with storage volumes and see if Longhorn will create and display the volume in the dashboard.
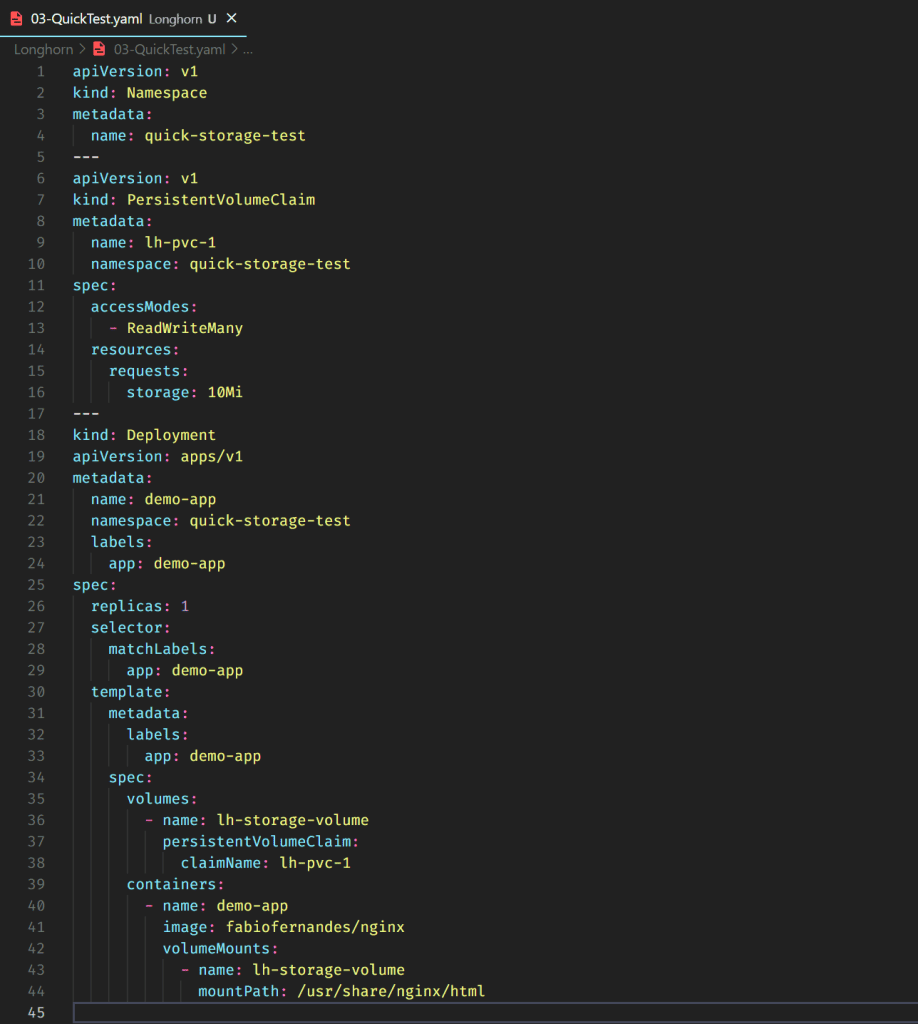
In this file, I’m doing three things:
- Create a namespace (to be easy to delete everything later)
- Create the persistent volume claim without any specification (it should use the default storage class)
- Create a deployment of a custom NGINX image with volumes using the previous PVC.
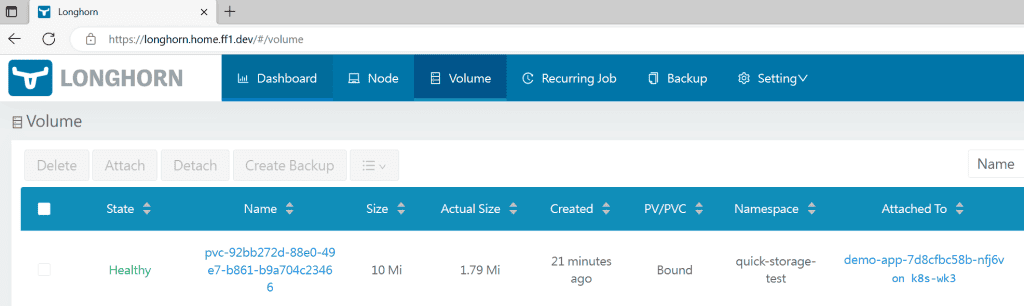
If everything works as expected, the site will be created and mounted a volume on Longhorn.
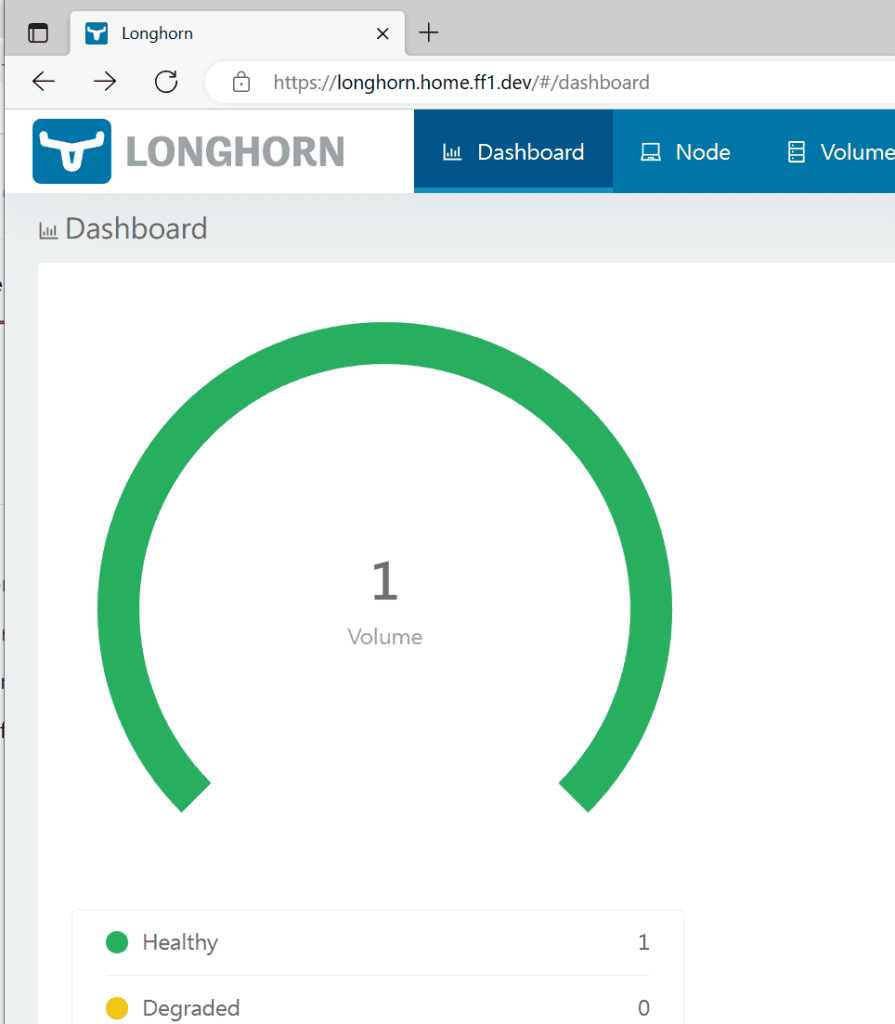
A healthy volume appeared on our dashboard.
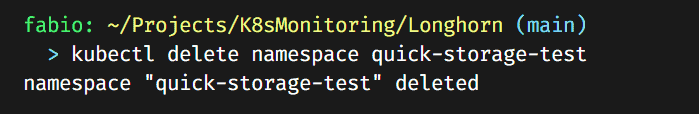
Now we can delete this namespace (that deletes everything inside) and check if the Longhorn will also delete the volume created.
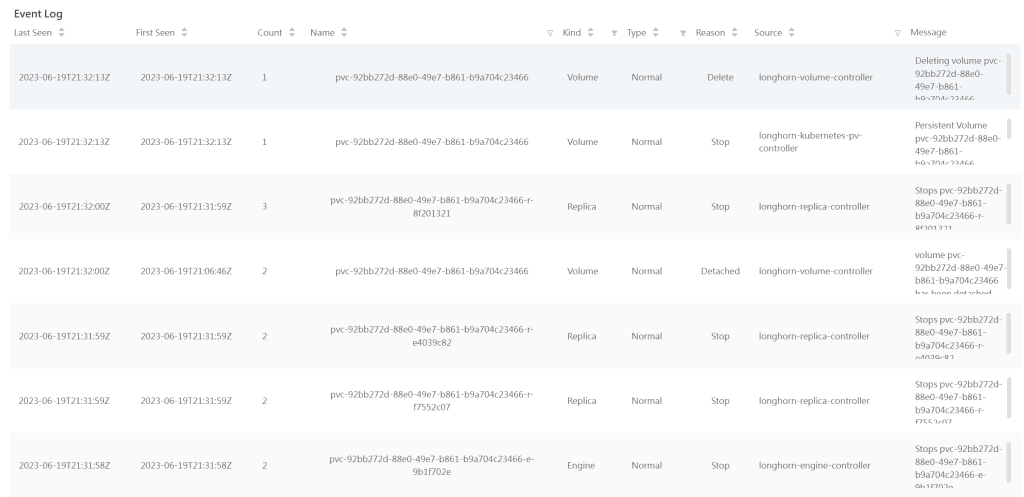
Checking the Longhorn logs, we can see a lot of movements and our volume being deleted as expected:
Installing Prometheus and Grafana
There’s no question about the popularity and use of Prometheus and Grafana in the monitoring world. If you work or plan to work in this area, you need to have contact with these two applications.
Created by SoundCloud and maintained by the community, Prometheus is an open-source alert and monitoring system, part of CNCF (Cloud Native Computing Foundation).
Pull and Push concepts.
Prometheus uses the concept of Pull Operation. It means that from time to time, the Prometheus service queries your application (via HTTP) and collects the data from there.
This method has pros and cons; in any way, you need to know the difference between these two monitoring methods.
In the picture below, you see a comparison between the Logstash/elastic search monitoring (logs) behavior and the Prometheus.
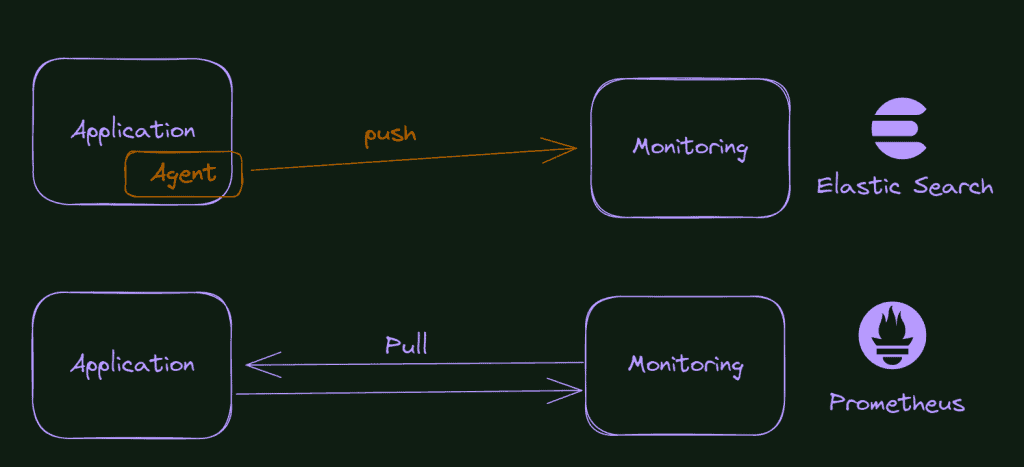
So, you only need to expose a page on your application with the metrics formatted according to the Prometheus schema. Although, what happens if the application is not yours? What if you want to monitor the database? Or your message bus? Or even the machine at the OS level? Well, it’s here that the exporters enter the scene.
A bunch of different exporters do that, collect data from a specific application and expose an http page to Prometheus with all this data.
So what is our final goal here, in terms of the improvement of our cluster monitoring system? Check the picture below.
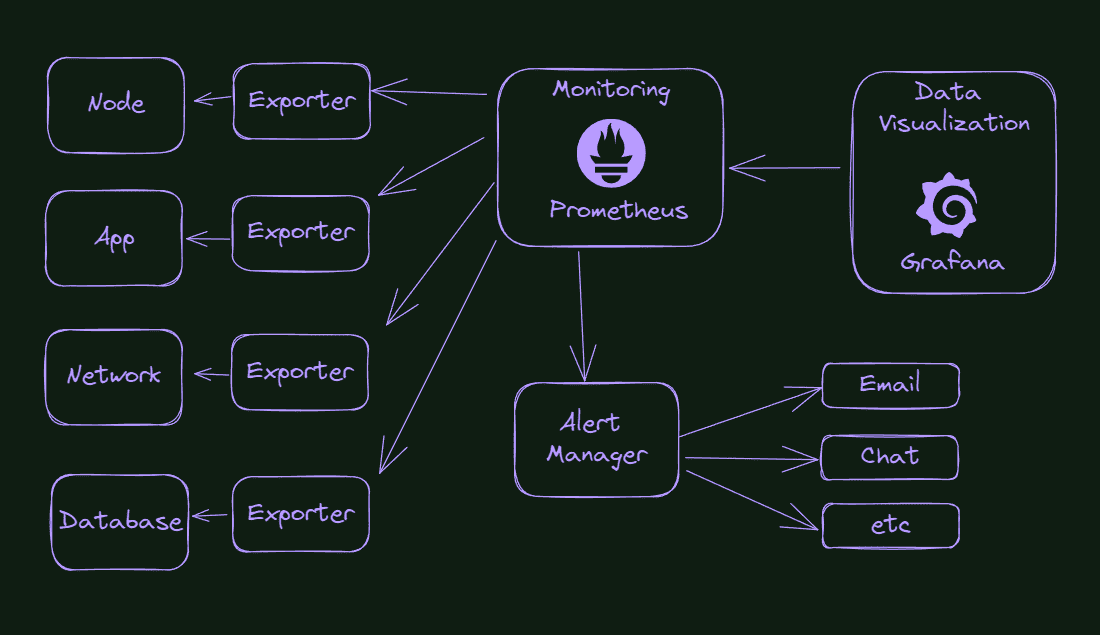
What do we see in the picture? Everything starts with the exporters capturing information from our cluster’s components, applications, or environment. From time to time, Prometheus will query these exporters and store this information. Suppose something is wrong or reaches a pre-configured threshold. In that case, Prometheus will send a message to the Alert Manager, that will know how to handle that information, for example, sending an email or sending a message in the Slack channel or something like that.
With all this data stored in Prometheus, we can configure charts and data visualization in Grafana.
Presenting Kube-Prometheus
As you can imagine, this configuration can be tedious and time-consuming. But we have a good alternative I will show you here. Kube-Prometheus is a repository on GitHub with a series of manifests, Grafana dashboards, and Prometheus rules ready to use. It’s a great head start for your cluster monitoring. You already collect and visualize valuable data out of the box, and you can edit and change these configurations as necessary.
The GitHub repository can be accessed here: https://github.com/prometheus-operator/kube-prometheus, and the components included in the package are:
- The Prometheus Operator
- Highly available Prometheus
- Highly available Alertmanager
- Prometheus node-exporter
- Prometheus Adapter for Kubernetes Metrics APIs
- kube-state-metrics
- Grafana
Install Kube-Prometheus
Install Kube-Prometheus is easy. First, we need to clone the official GitHub repository. After that, we will execute the manifests present into the manifests/setup folder… It will create all the CRDs we need to operate the Prometheus, Grafana, and alert manager. It will also create the monitoring namespace for us.
kubectl create -f manifests/setup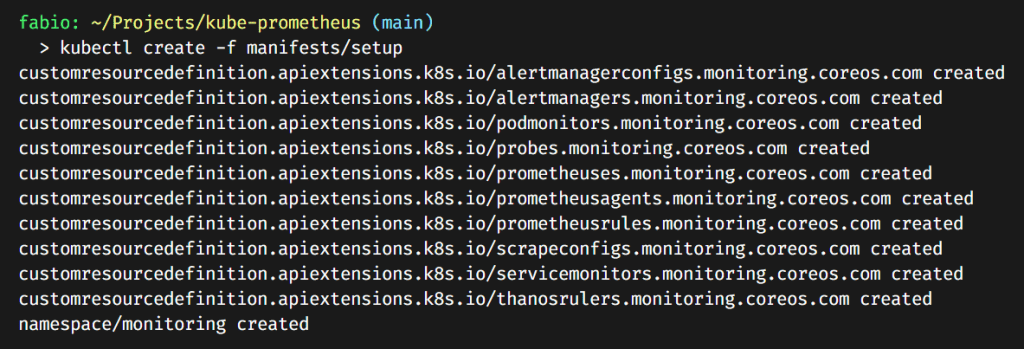
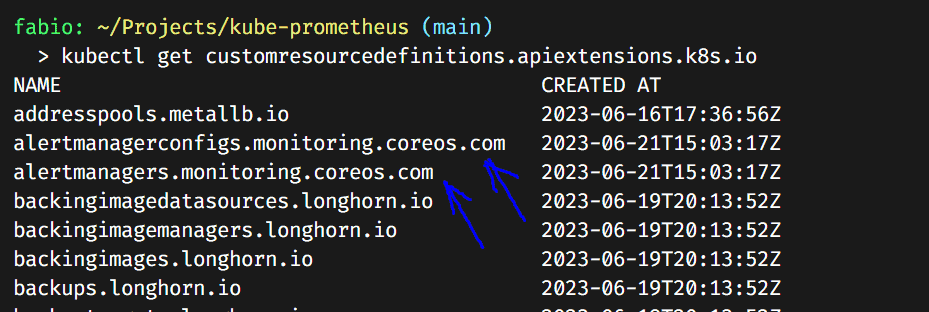
We can check our CRDs (Custom Resource Definitions) and see the ones we created present in our cluster.
Now, let’s apply the rest of the manifests.
kubectl apply -f manifestsIt should install all the Kube-Prometheus Stack (a lot of stuff); you can check the pods in the monitoring namespace.
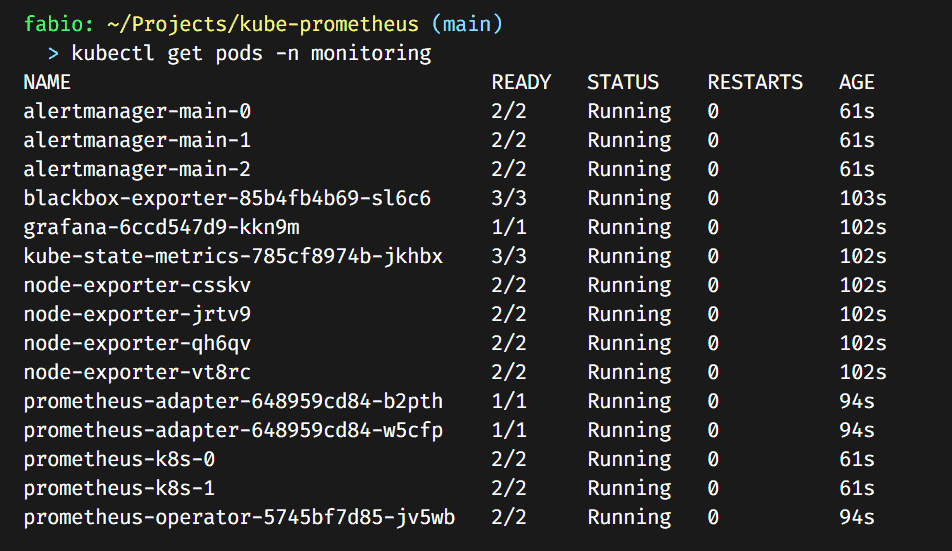
As you can see, now we have running Prometheus, Grafana, Alertmanager, Blackbox Exporter, and Node Exporter installed.
Configuring Grafana dashboard
First, let’s check if the Grafana service is running:
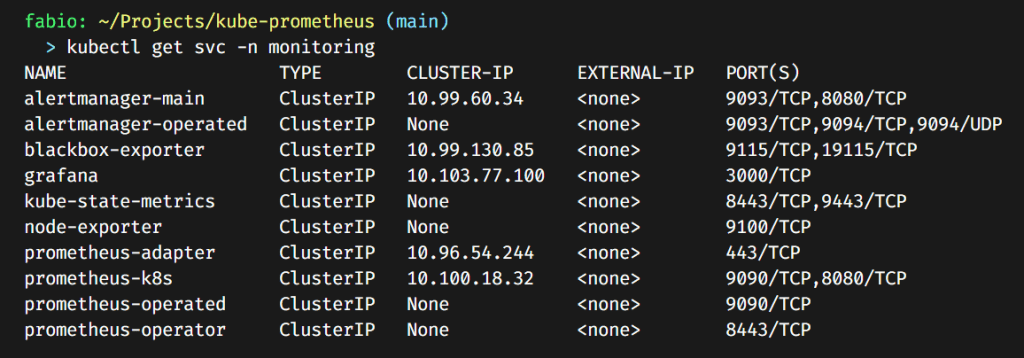
It’s there, a cluster IP service, exposing port 3000. If you remember well, what do we need to configure and expose this service with ingress and https?
- Change /etc/hosts file or your local DNS
- Create the certificate and store it in a secret, using cert-manager
- Create the ingress route configuration to connect the dots.
Let’s do it…
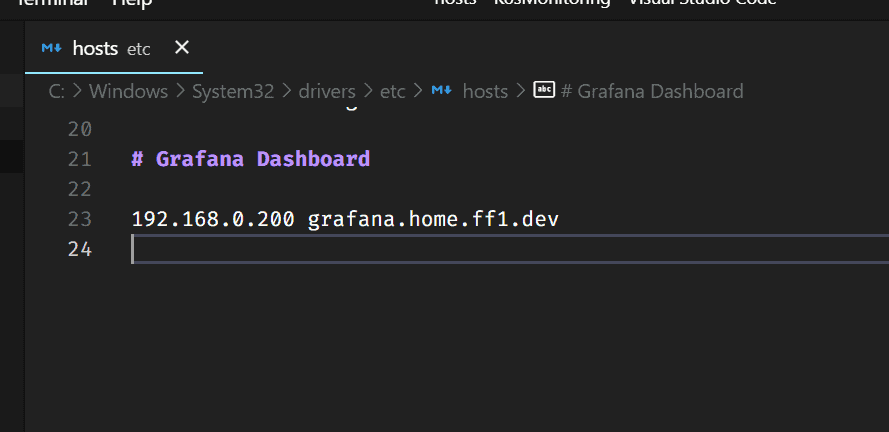
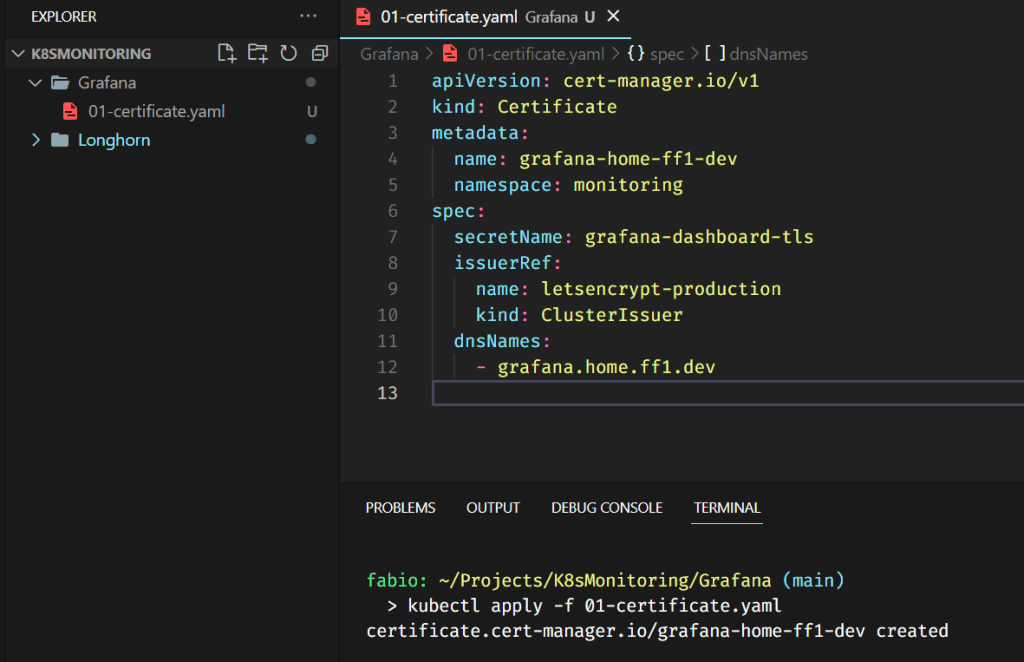
Please pay attention: We are creating this certificate on the monitoring namespace. The certificate needs to be in the same namespace as your application.
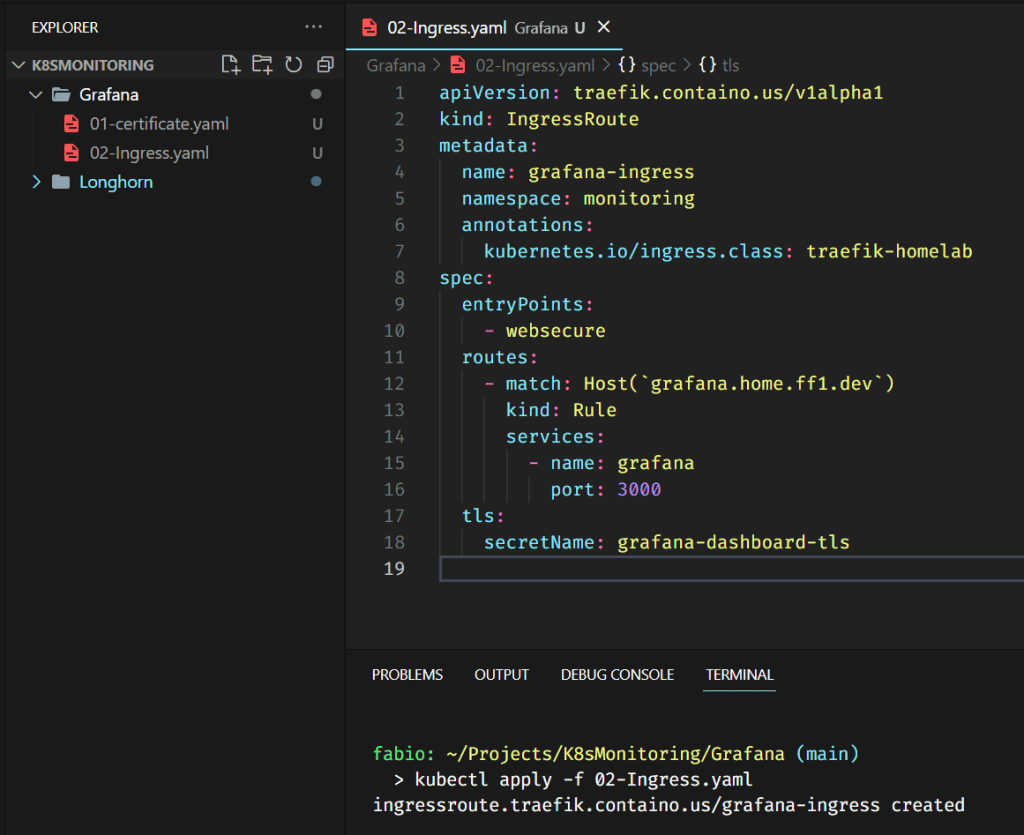
Nothing special here; we are pointing the DNS entry (grafana.home.ff1.dev) to the service grafana on port 3000. We also use the certificate from the secret grafana-dashboard-tls, which we generated via Cert-Manager using Let’s Encrypt issuer and Cloudflare DNS. If you want to learn more about how these components and services work together, please, read my article Managing SSL in your K8s Homelab, where I describe all these mechanisms in detail.
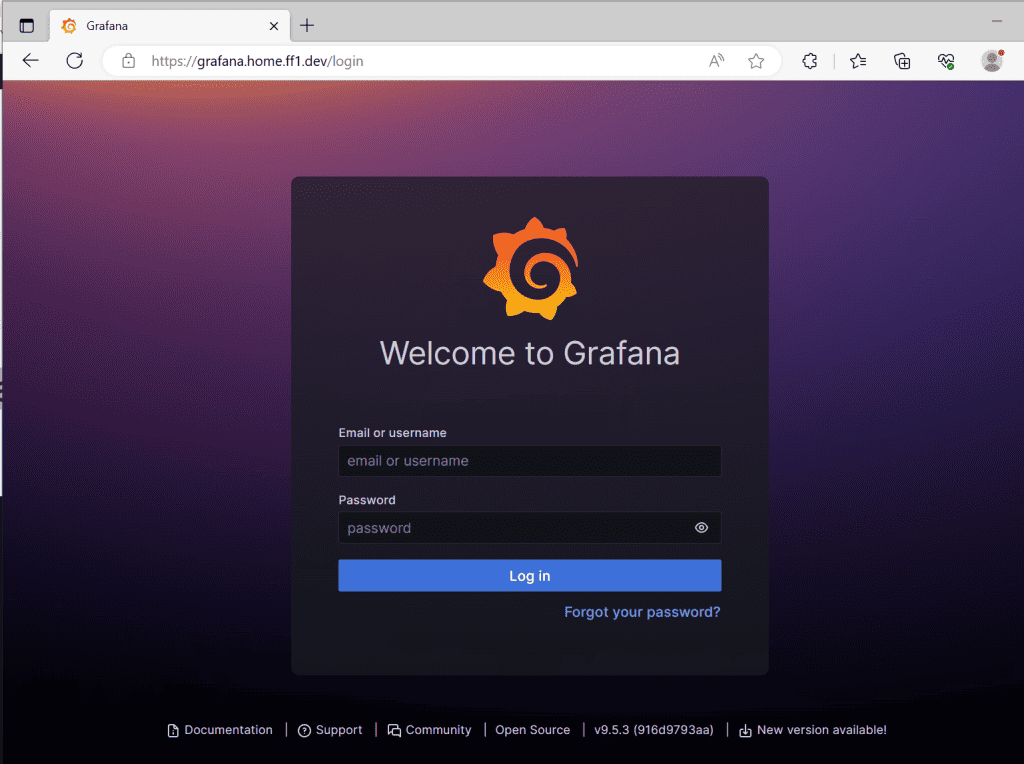
The Grafana dashboard should be visible on the configured domain and will redirect you to the login page. The default user and password are adminYou will be asked to change the password at the first access.
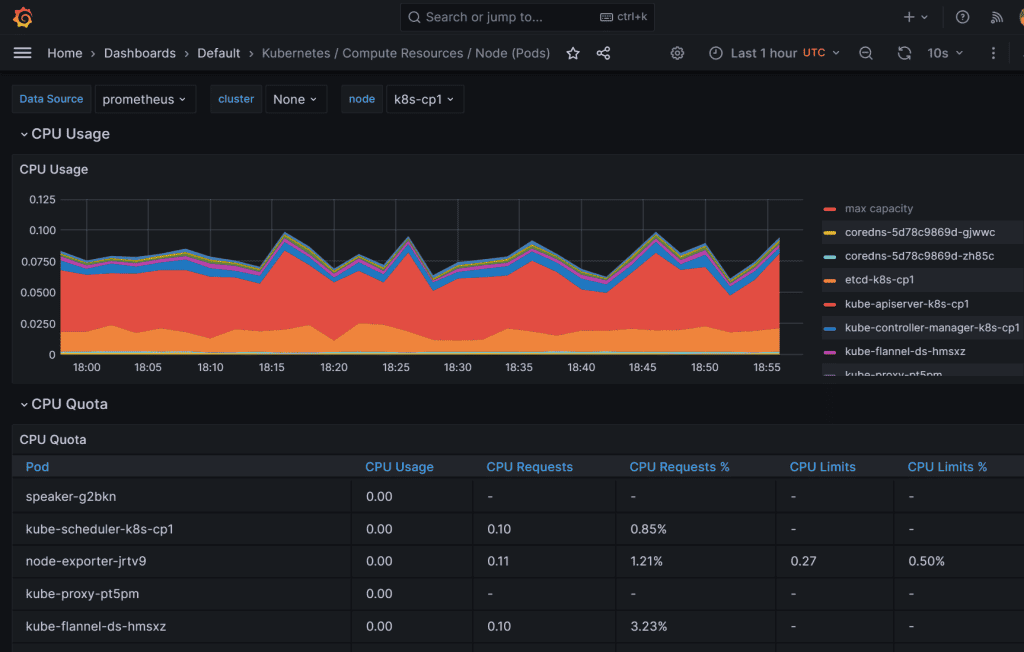
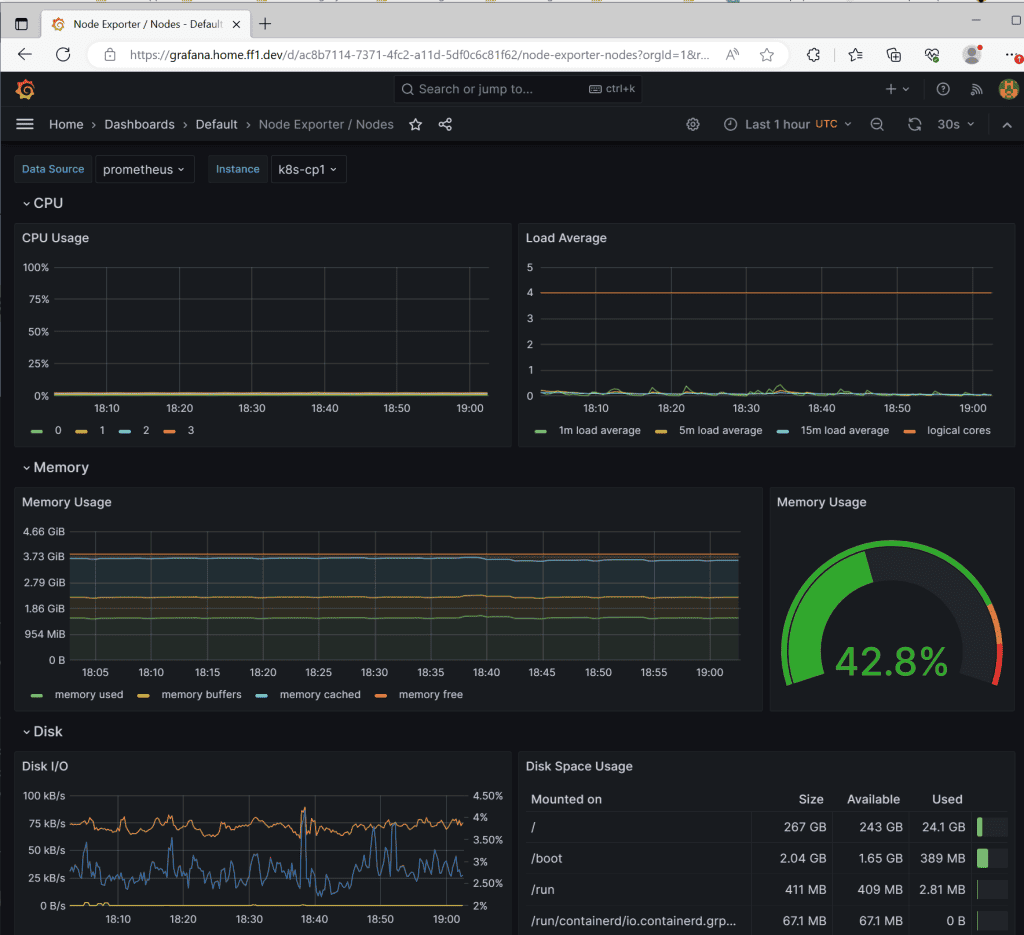
I still have a lot of CPU processing power available for my apps, lol… Play around; there are a lot of metrics you can see with different dashboards.
Conclusion
In conclusion, Kubernetes monitoring with Prometheus and Grafana offers a powerful and efficient solution for gaining insights into the performance and health of a Kubernetes cluster. By leveraging Prometheus, a highly customizable and scalable monitoring system, and Grafana, a feature-rich visualization tool, organizations can effectively monitor key metrics and ensure the smooth operation of their Kubernetes infrastructure. Prometheus’s flexible querying language and robust data collection capabilities allow for real-time monitoring, alerting, and analysis of various components, including containers, pods, nodes, and services. Grafana complements Prometheus by providing intuitive dashboards and visualizations that enable users to monitor and analyze data in a user-friendly and customizable manner. Together, Prometheus and Grafana form a comprehensive monitoring stack that empowers DevOps teams to proactively identify issues, optimize resource allocation, and maintain the stability and performance of their Kubernetes deployments.